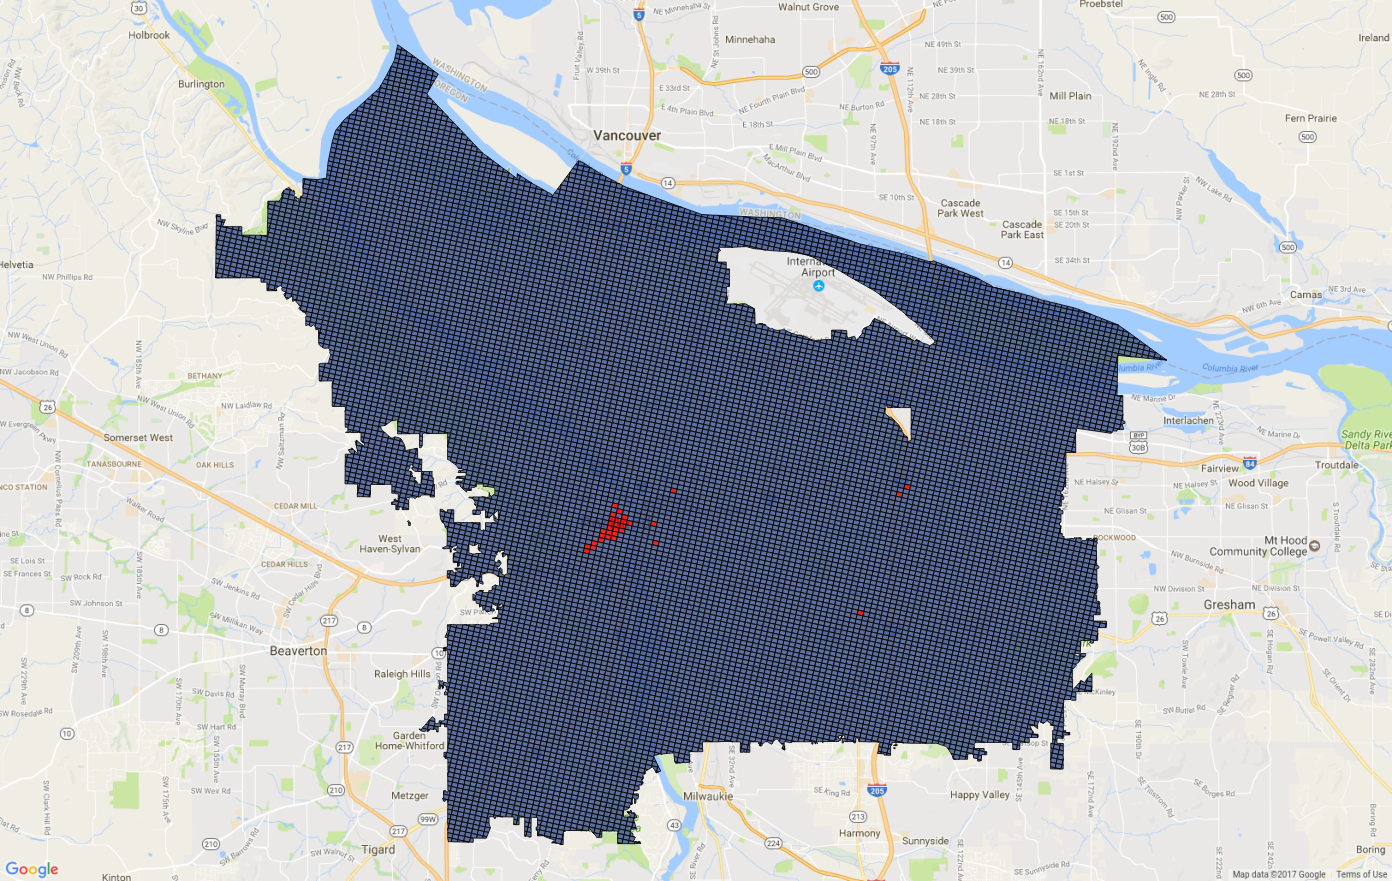
1-week Forecast of All Calls for Service
Statistics for Economists (Spring 2017) [Course Page] [Course GitHub]
vcov: fast methods for computing covariance matrices from model objects; especially useful for bootstrapping. On CRAN here.
texr: simple, robust interface for converting R objects into TeX tables, etc. Very early-stage.
portland: Code associated with Team Kernel Glitch's submission to the NIJ Real-Time Forecasting Challenge, where we tied for first place in the Large Business category; working paper.
1-week Forecast of All Calls for Service
Distribution of Initials: Derived from the roughly 85 million observations in the Social Security Death Master File, a simple two-way table-as-heat-map showing the most- and least-common initials in the United States. There's also this interactive shiny applet which displays the top 10 initial pairs in each year. Code using data.table, iotools, RColorBrewer, funchir, and shiny found here; also includes some reduced-size .csv files containing aggregated counts.
All-Time MLB Home Run Leaders: I made a shiny app which depicts, for a chosen year, the make-up of the top-ten list in the MLB for all-time home runs, and the trajectory of how each player's HR count evolved over the course of their career. The code for this is here.
Competitiveness of Major Sports Leagues: Using the Gini coefficient on win percentages within a season (recorded from a web scraping exercise) to quantify the evolution over time of the competitiveness of each of the four major sports leagues in the USA -- NFL, MLB, NBA, and NHL. Code here.
Citation Signature Plot of Economics Journals: As suggested by Frank Diebold, an alternative to the standard journal impact factor is to compare the rank-order statistics of the most cited articles in each journal; by this metric, too, the usual suspects emerge as most reputable. Code for scraping and plot here.
Admittance of Iraqi Refugees to the US: Scraping data from the US Department of State website, plot the number of refugees from Iraq admitted to the US each month since October, 2007. Add to this a three-month moving average, and a shading surrounding the stated period of "re-vetting" following the discovery of a shortcoming in this process circa May, 2011.
you can check out the rest of my analysis portfolio at my GitHub Page